Coalition Networks
NETWORK FOR Massachusetts
1,058
ORGANIZATIONS
168,354
POSITIONS
Color Reference
AGREE / SUPPORT
NEUTRAL
DISAGREE / OPPOSE
How to Explore a Coalition Network
Coalitions
Each circle represents a interest group coalition, or a collection of interest groups that tend to agree in their lobbying. The number of dots within the circle represents the number of interest groups in that coalition, and the pie chart ringing the circle represent the coalition’s distribution of support (green), neutral (blue), and oppose (red) positions.
Mouse over a coalition to see its size, number of positions, and its top three members.
Edges
The green and red edges extending between the coalitions represent agreements and disagreements, respectively, between their members on legislative positions. The thicker the edge, the more agreements/disagreements between those two coalitions.
Mouse over an edge to see the number of agreements and disagreements between two coalitions.
Intra-coalition networks
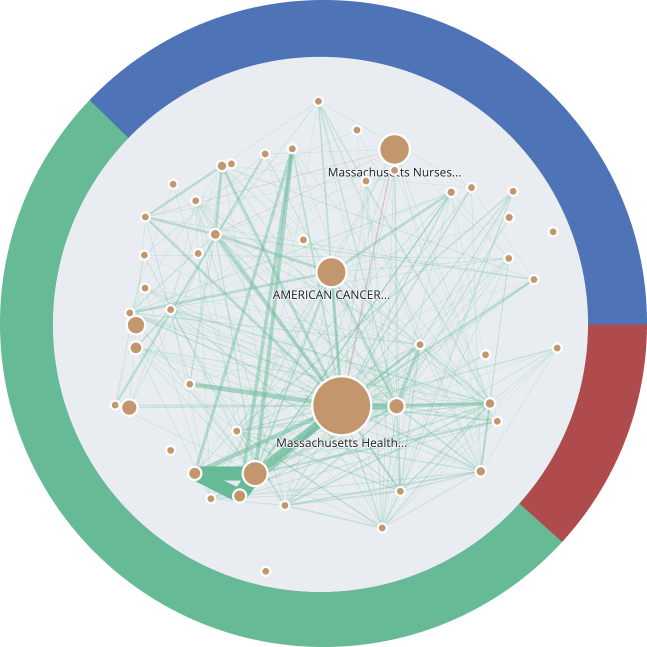
Click on a coalition to zoom in and view a detailed intra-coalition network of the top interest groups in that coalition. Each node represents an interest group. The bigger the node, the greater percentage of positions held by that interest group. Just as in the larger network, edges between interest group nodes represent the number of agreements/disagreements between those two interest groups.
Mouse over a coalition to see its size, number of positions, and its top three members.